R is a free statistical, visualisation and data manipulation software. Anyone who works with data can benefit from using R but it is hard to learn.
Created by scientist and educator Dr Shidan Murphy, R Instructor is a statistical and R reference guide. The application uses plain, non-technical language and over 35 succinct videos to guide new users and reinforce concepts for advanced R users. The number and scope of the videos and content will continue to increase.
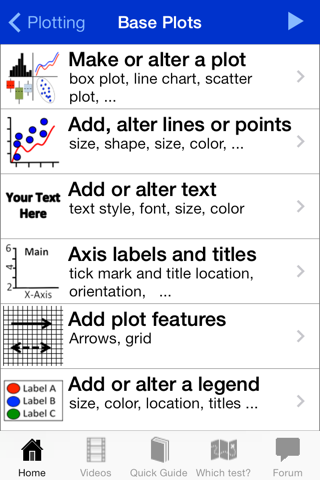
R Instructor will teach you how to use R, how to make and modify plots and run statistical tests. Each example includes a very brief (and easy to understand!) description of the function or test, any statistical assumptions, how to structure your data in R, the R scripts (code) and, links to other free and online resources. Where appropriate, the Mac, Windows and RStudio versions of the R interface are explained separately.
R Instructor also allows you to run RStudio through the web from your iPad or iPhone (Note: This is a public server that requires an internet connection -- do not expect to accomplish serious computing)
In addition, R Instructor comes complete with 10 Quick Reference guides and the "Which Test?" feature. The "Which Test?" feature guides you to the correct statistical test after you answer questions related to your data.
See a demonstration of R Instructor at, www.Rinstructor.com
Use R Instructor to...
Run a public web server implementation of RStudio (do not expect serious computing power -- this server is for testing and debugging scripts)
Learn Rs fundamentals:
- Rs interface
- Create objects
- Install librariespackages
- Import and export data and plots
- Merge data frames
- Exclude redundant data between datasets
- Import dates
- Create custom functions
- Summarize data frames and matrices
- Perform calculations
- and more...
Learn how to make and customize plots:
- qplots from ggplot2
- Box plots
- Bar plots
- Histograms
- Line charts
- Scatter plots and scatter plot matrices
- Add and customize legends
- Add custom axis labels
- Modify the size, shape and colour of point markers
- Add axis titles
- Add lines, text or points to an existing plot
- Add colour to the plot background, border lines… and just about anything else!
Learn these (and more) statistical tests:
- One-sample t-test
- Two-sample t-test
- Paired t-test
- Correlation
- Rank correlation
- Linear regression
- Multiple regression
- Logistic regression
- Log-linear models
- F-test
- One-way ANOVA
- Two-way ANOVA
- One-way repeated measures ANOVA
- Two-way repeated measures ANOVA
- Regression and Classification trees
- ANCOVA
- MANOVA
- Principal Components Analysis
- Linear discriminant function analysis
- Redundancy analysis
- Friedman test
- Wilcoxon signed rank test
- Kruskal-Wallis test
- Chi-square test of independence
- Binomial test
- Hierarchical clustering
- and more…
Plus,
- Over 35 videos (thats over two hours)
- 10 Quick Reference Guides
- The "Which test?" feature – An assistant to guide you to the appropriate statistical test


